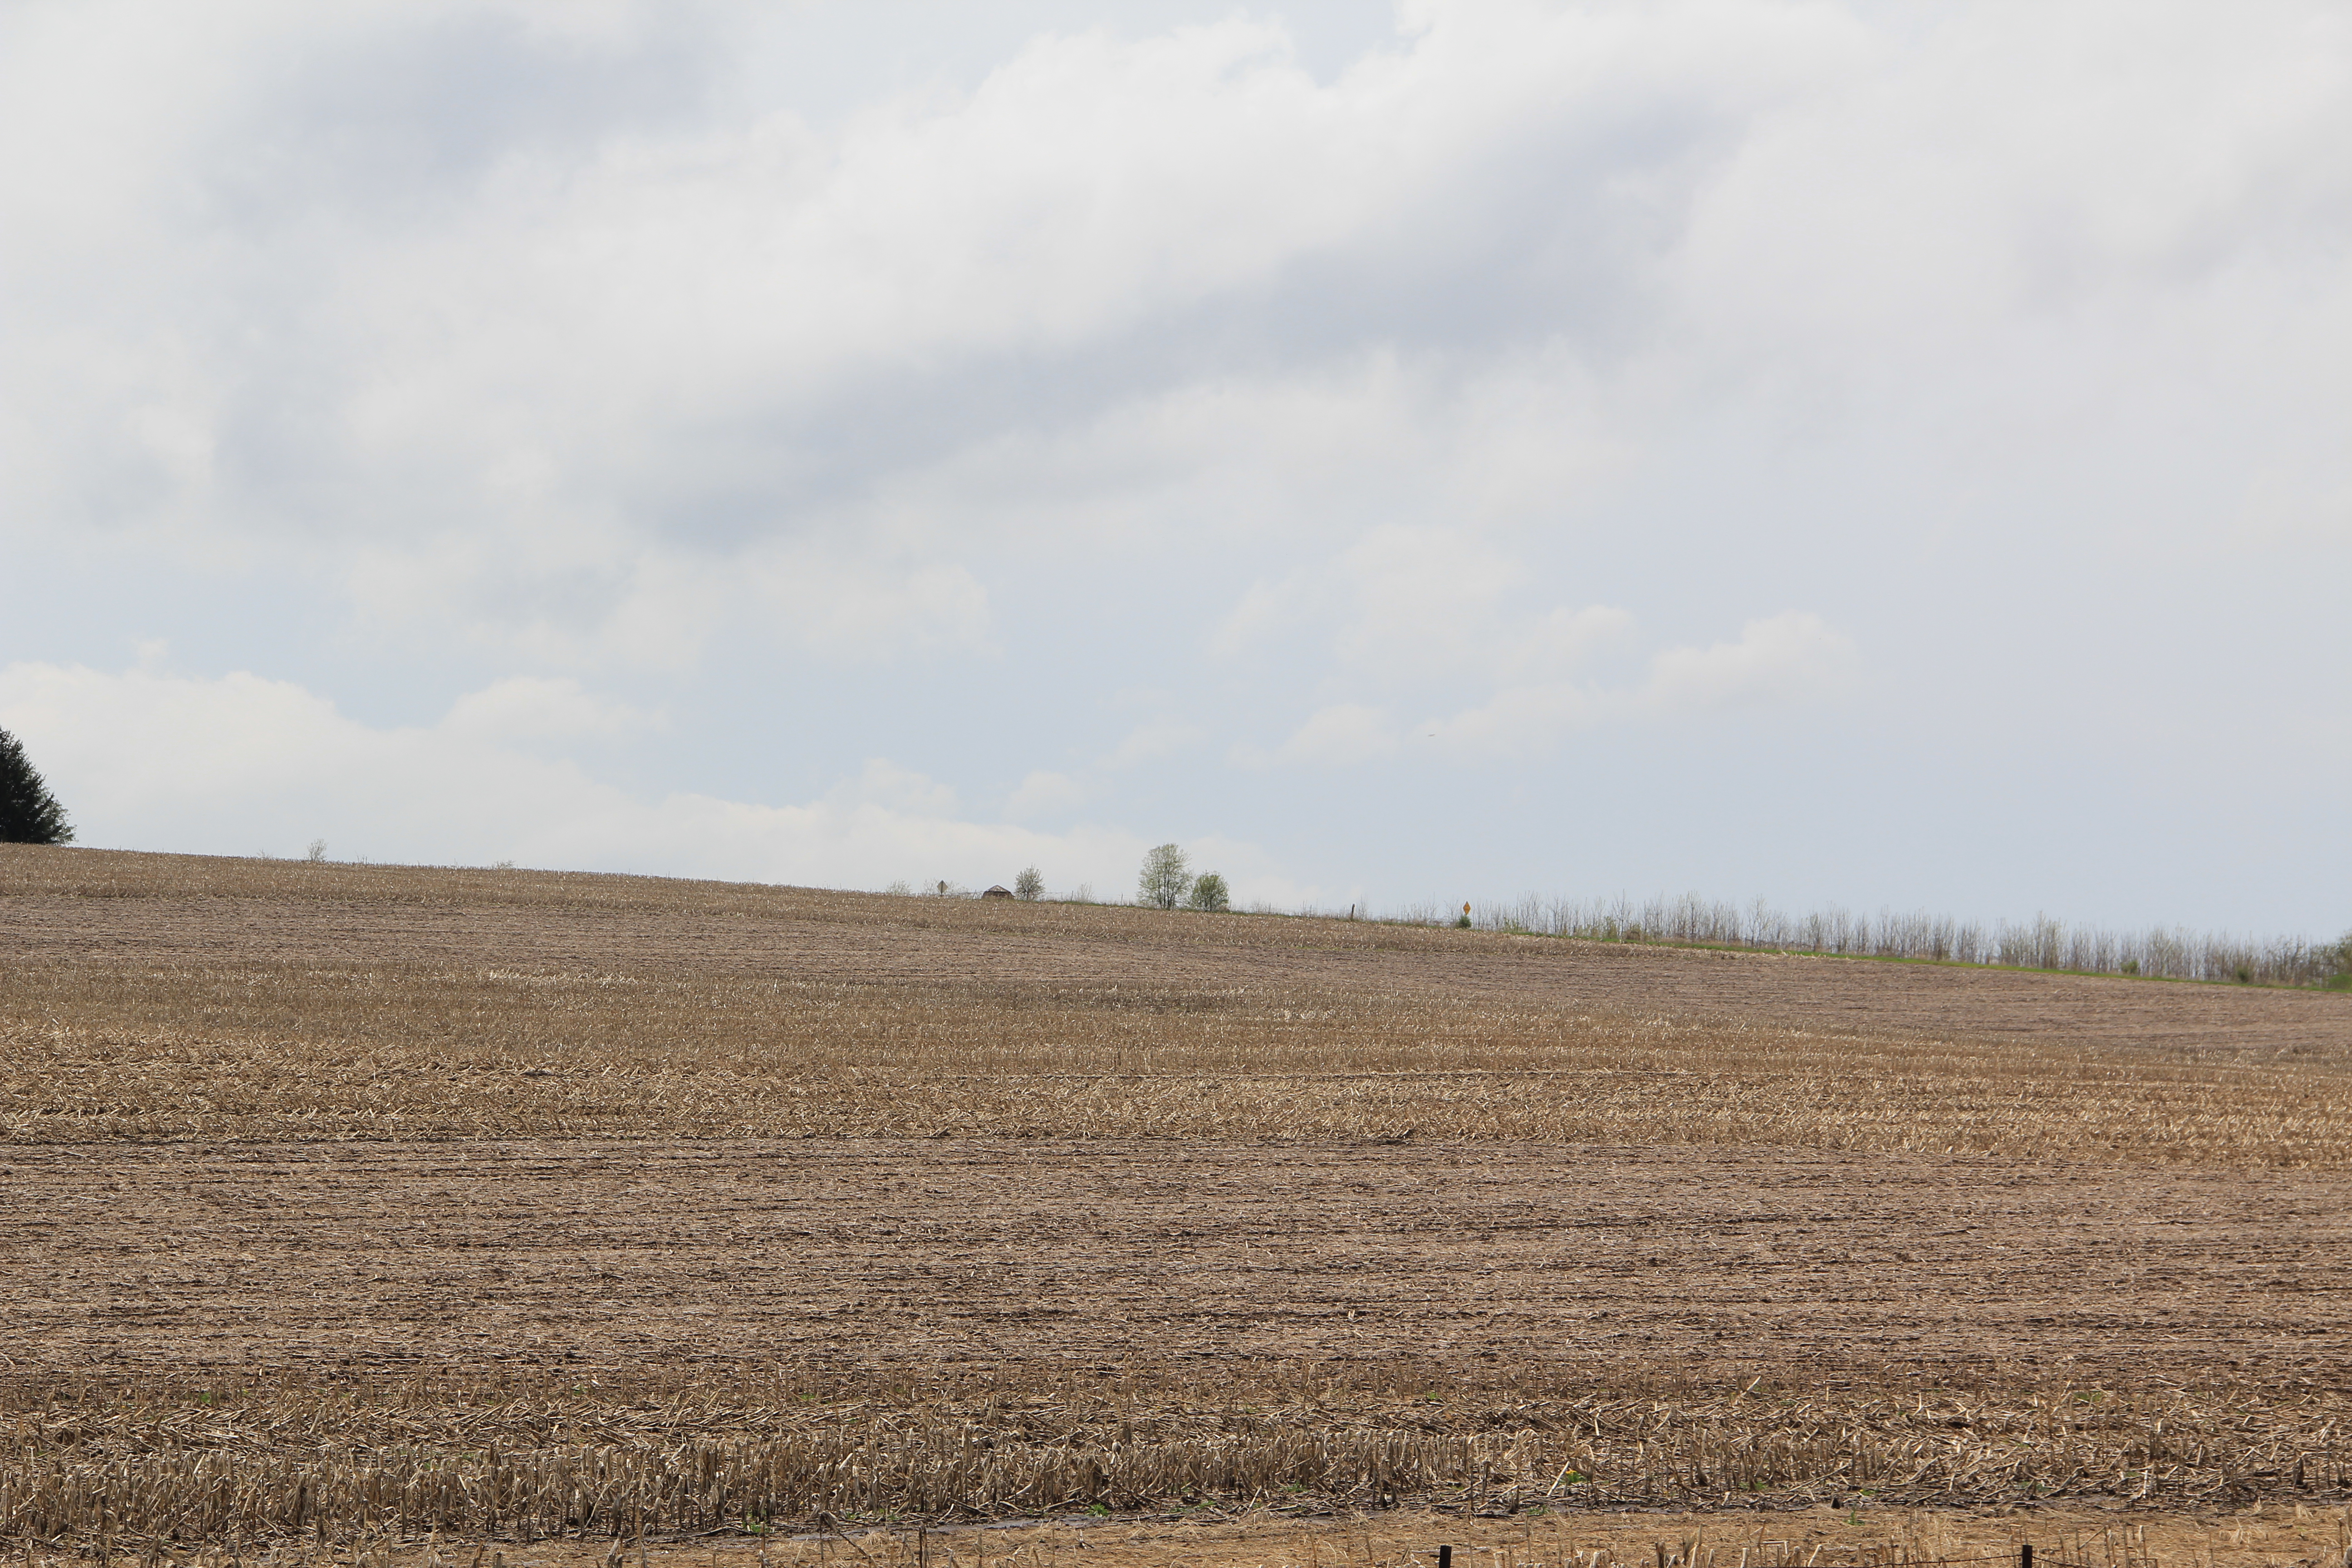
Between Sunday May 11th and Monday May 12th, 2014, the Turkey River Watershed received on average 2.43 inches of rainfall. Two Iowa Flood Center rain gauges placed in the watershed recorded the 2.55 and 2.31 inches of rainfall(rain gauge data can be accessed here). Attached is a series of pictures that contrasts how agricultural lands in the Turkey River Watershed received and responded to the rain that fell over that 48 hour period. On Monday May 5th, USDA reported the corn crop in Iowa being 23% planted. By the time this rain occurred, that number had jumped to 80% complete. Over 50% of Iowa’s fields had been planted in less than a week. Examples like this show the value of cover crops, no-till, and other conservation minded practices.
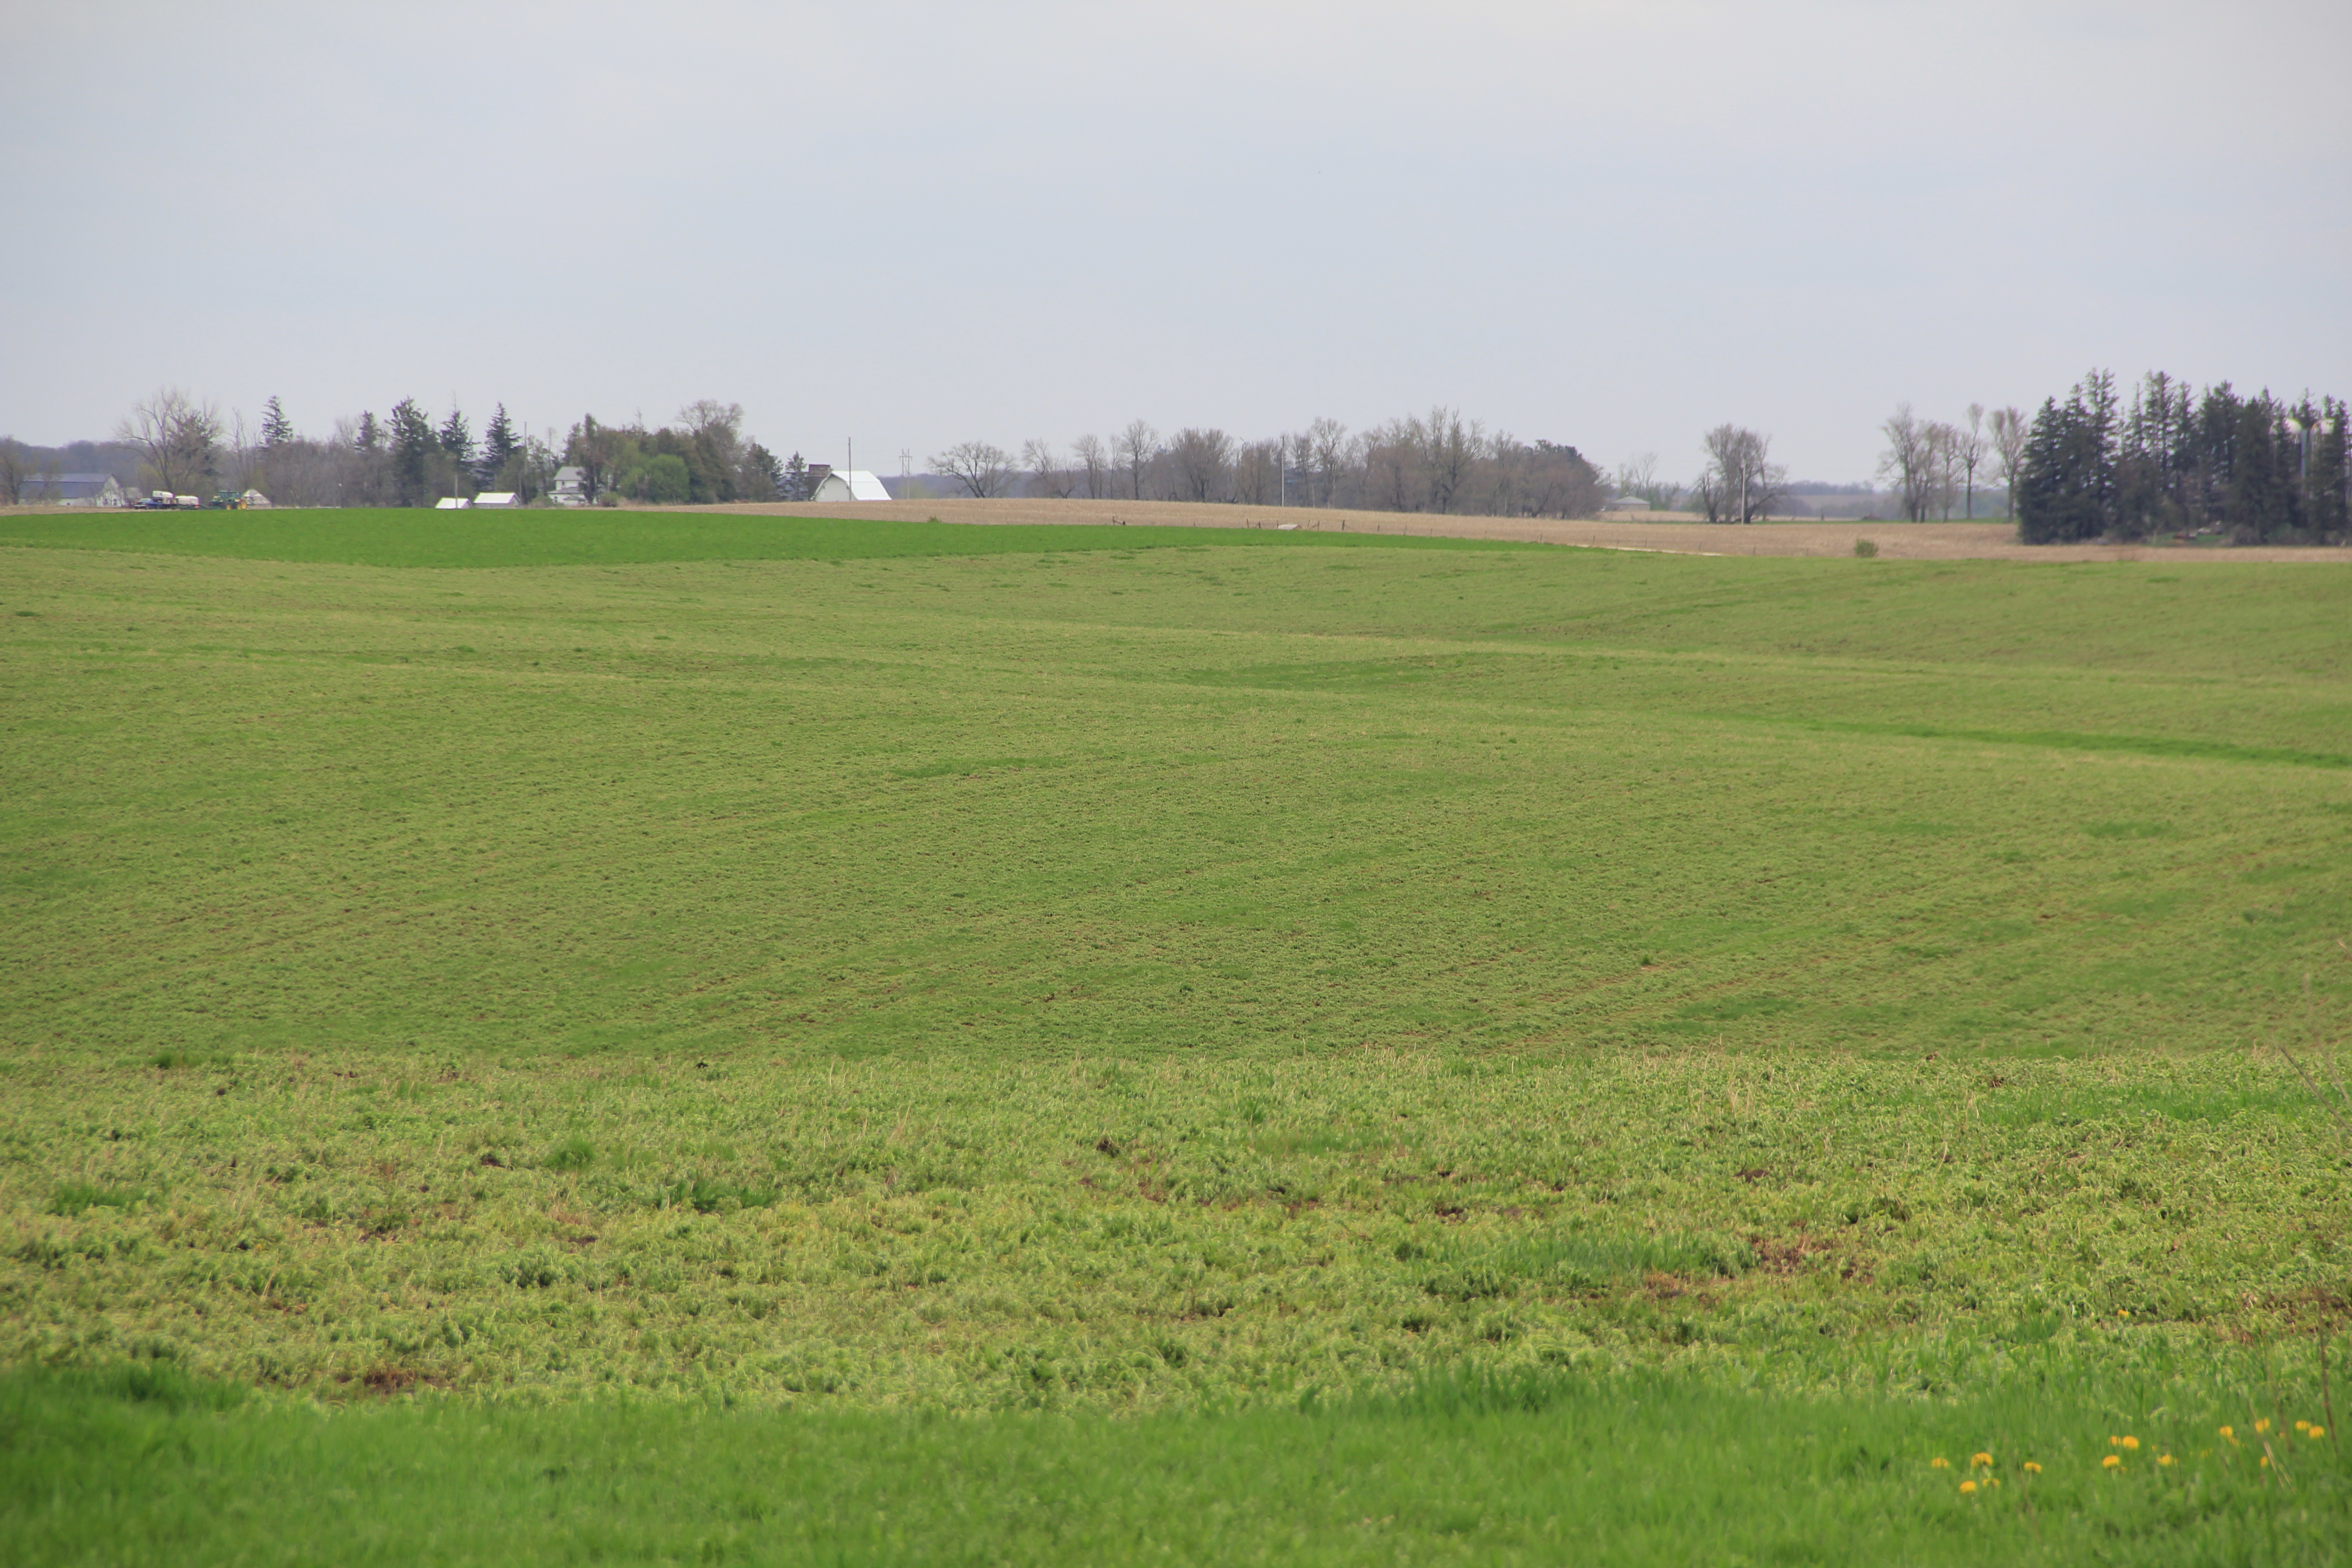
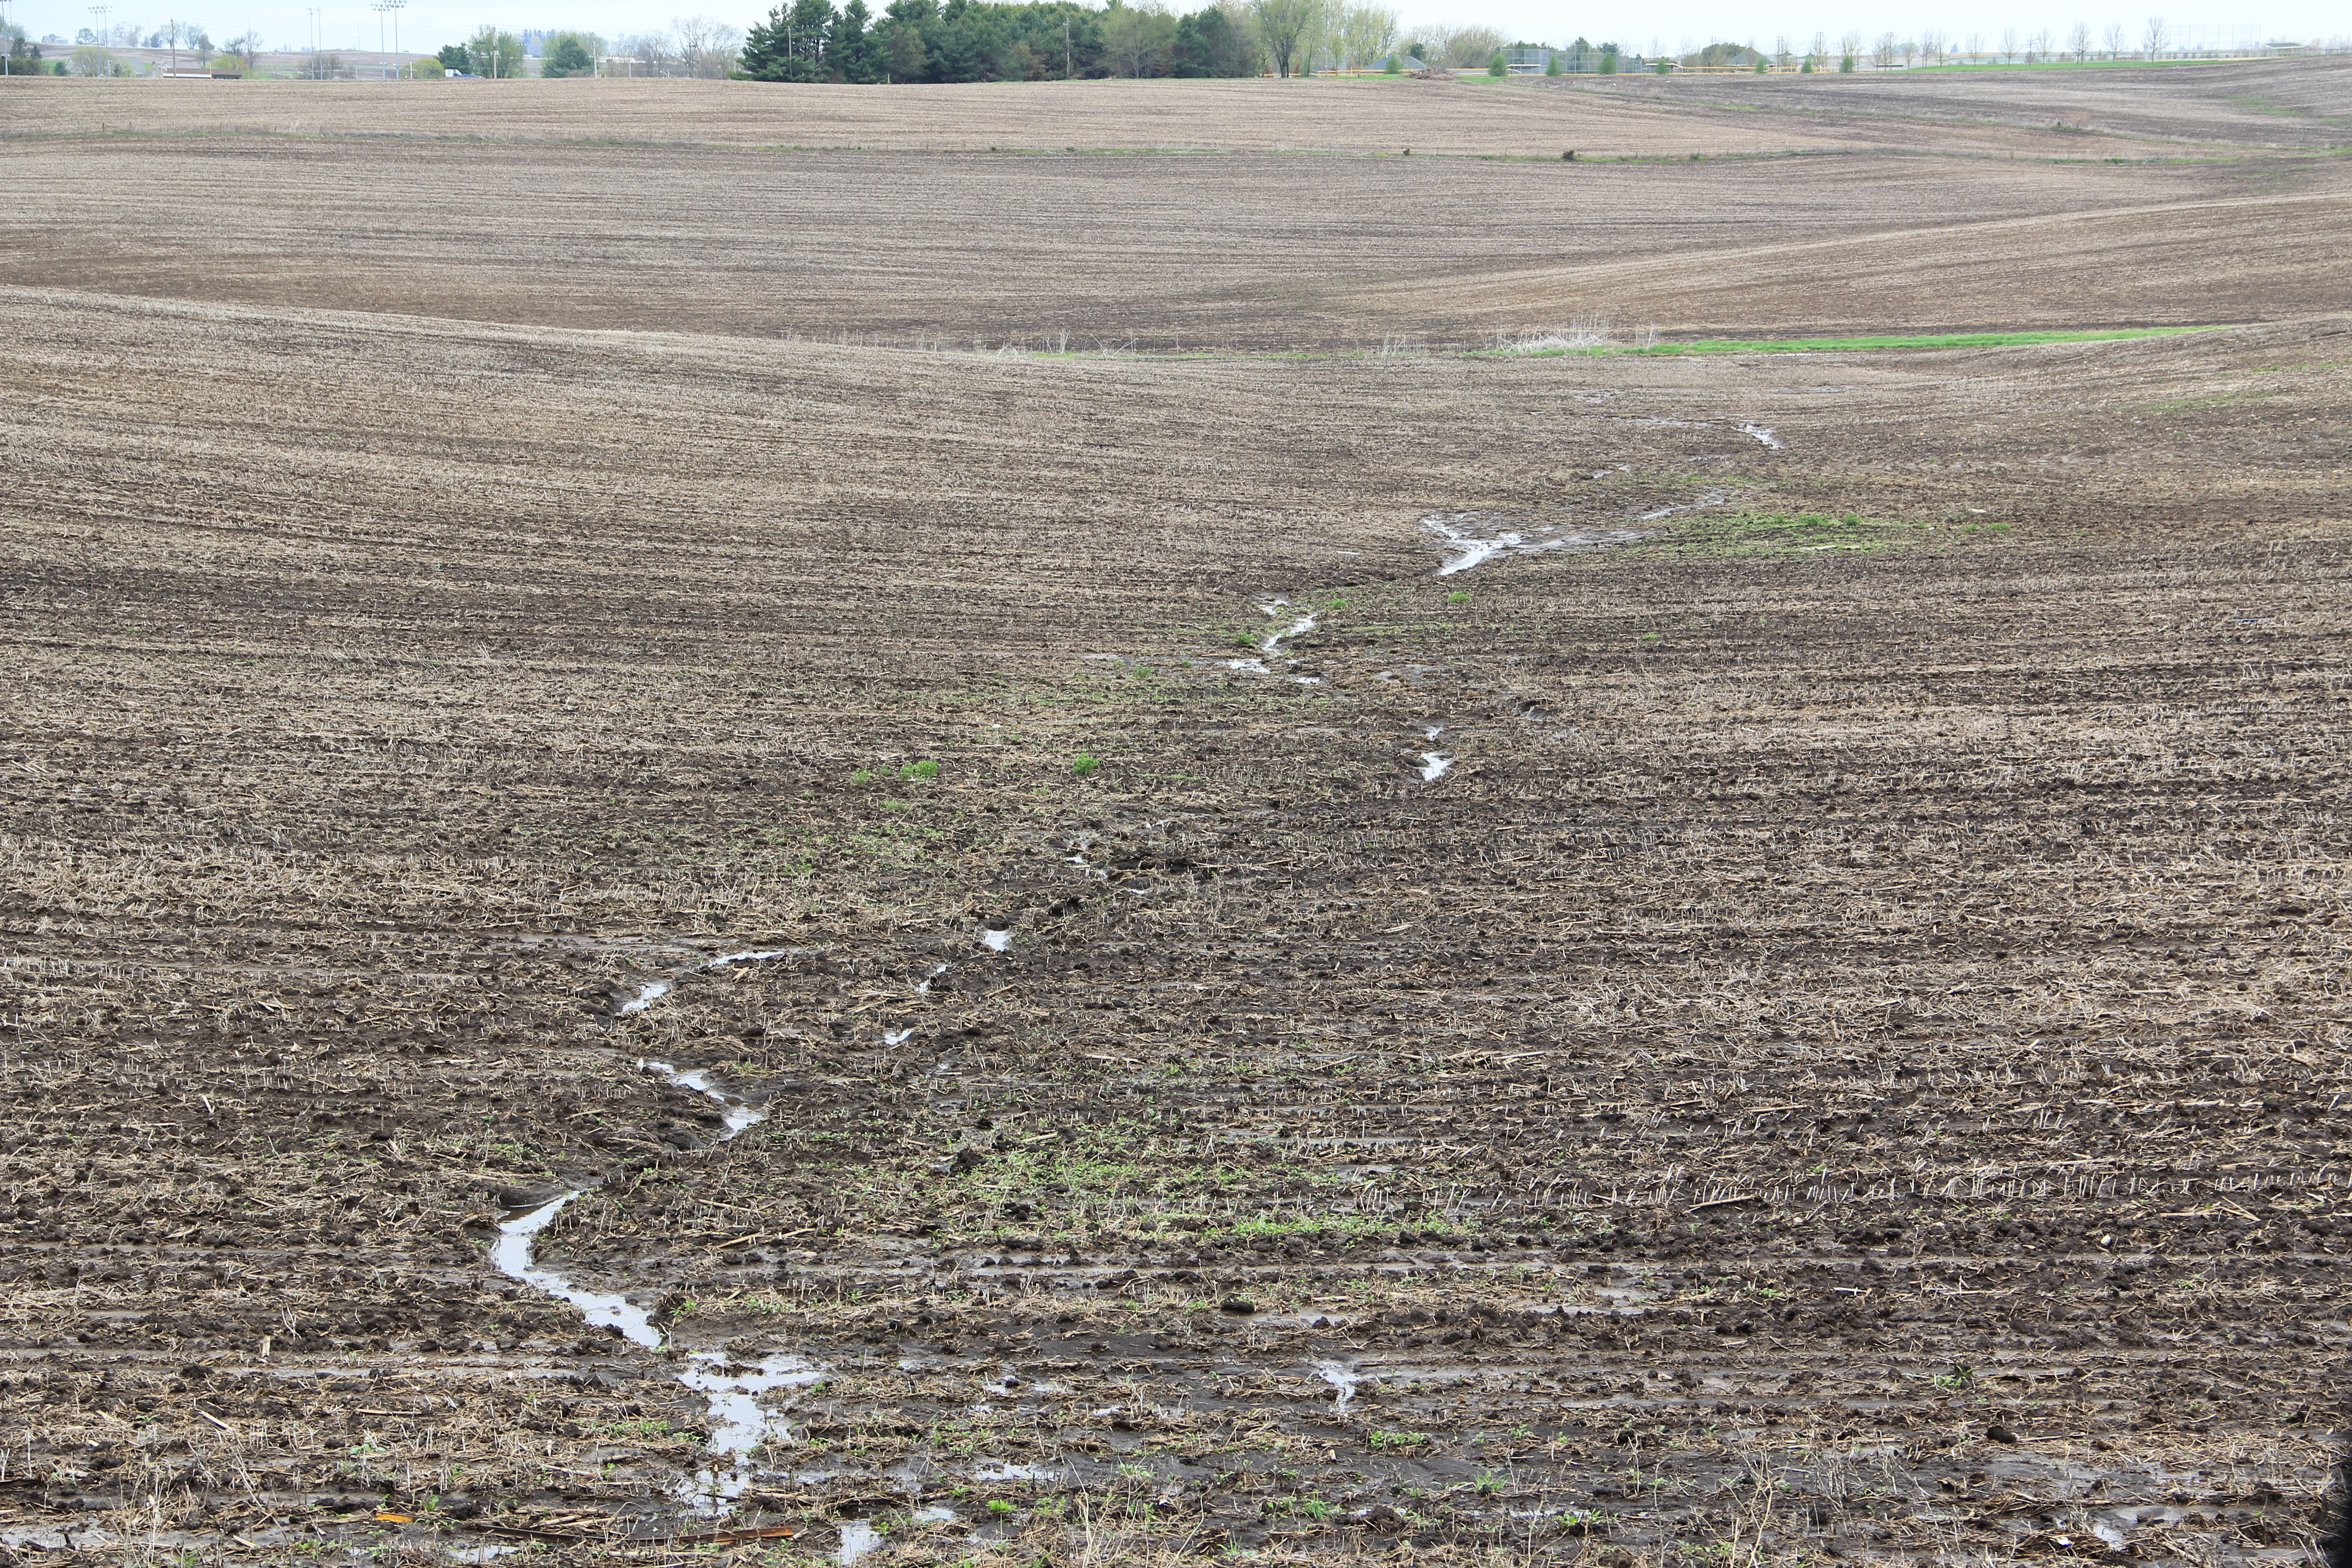
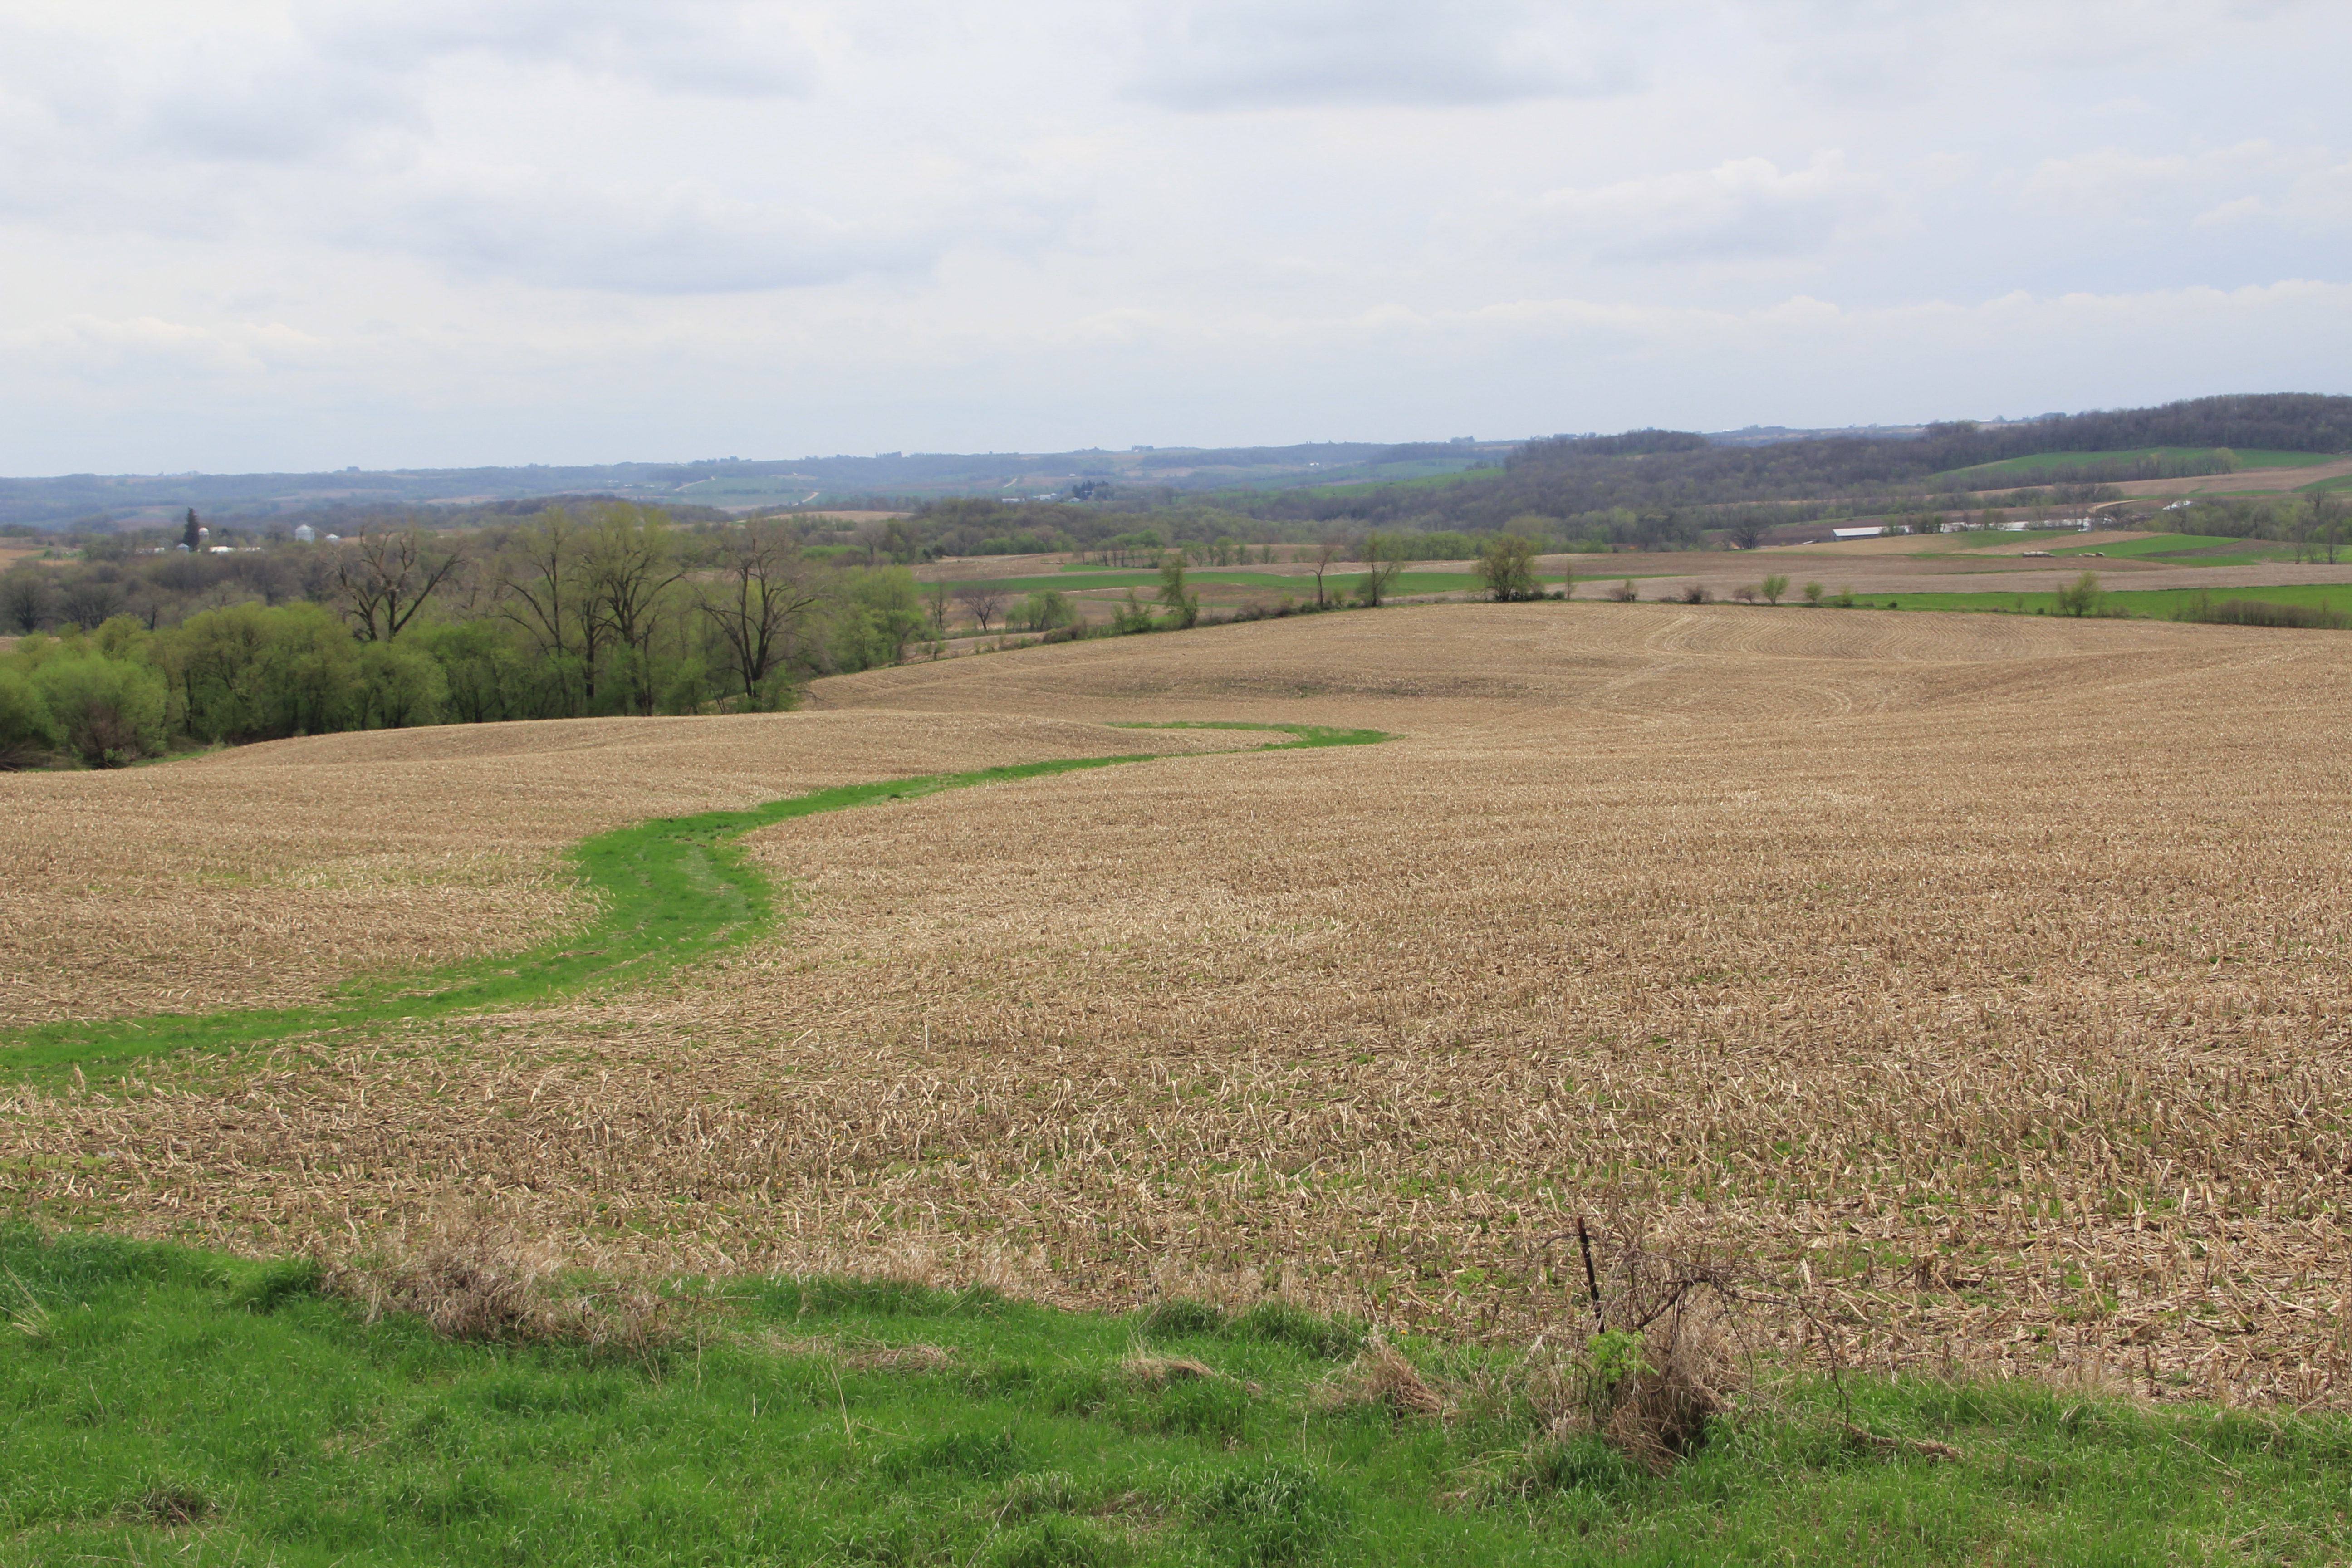
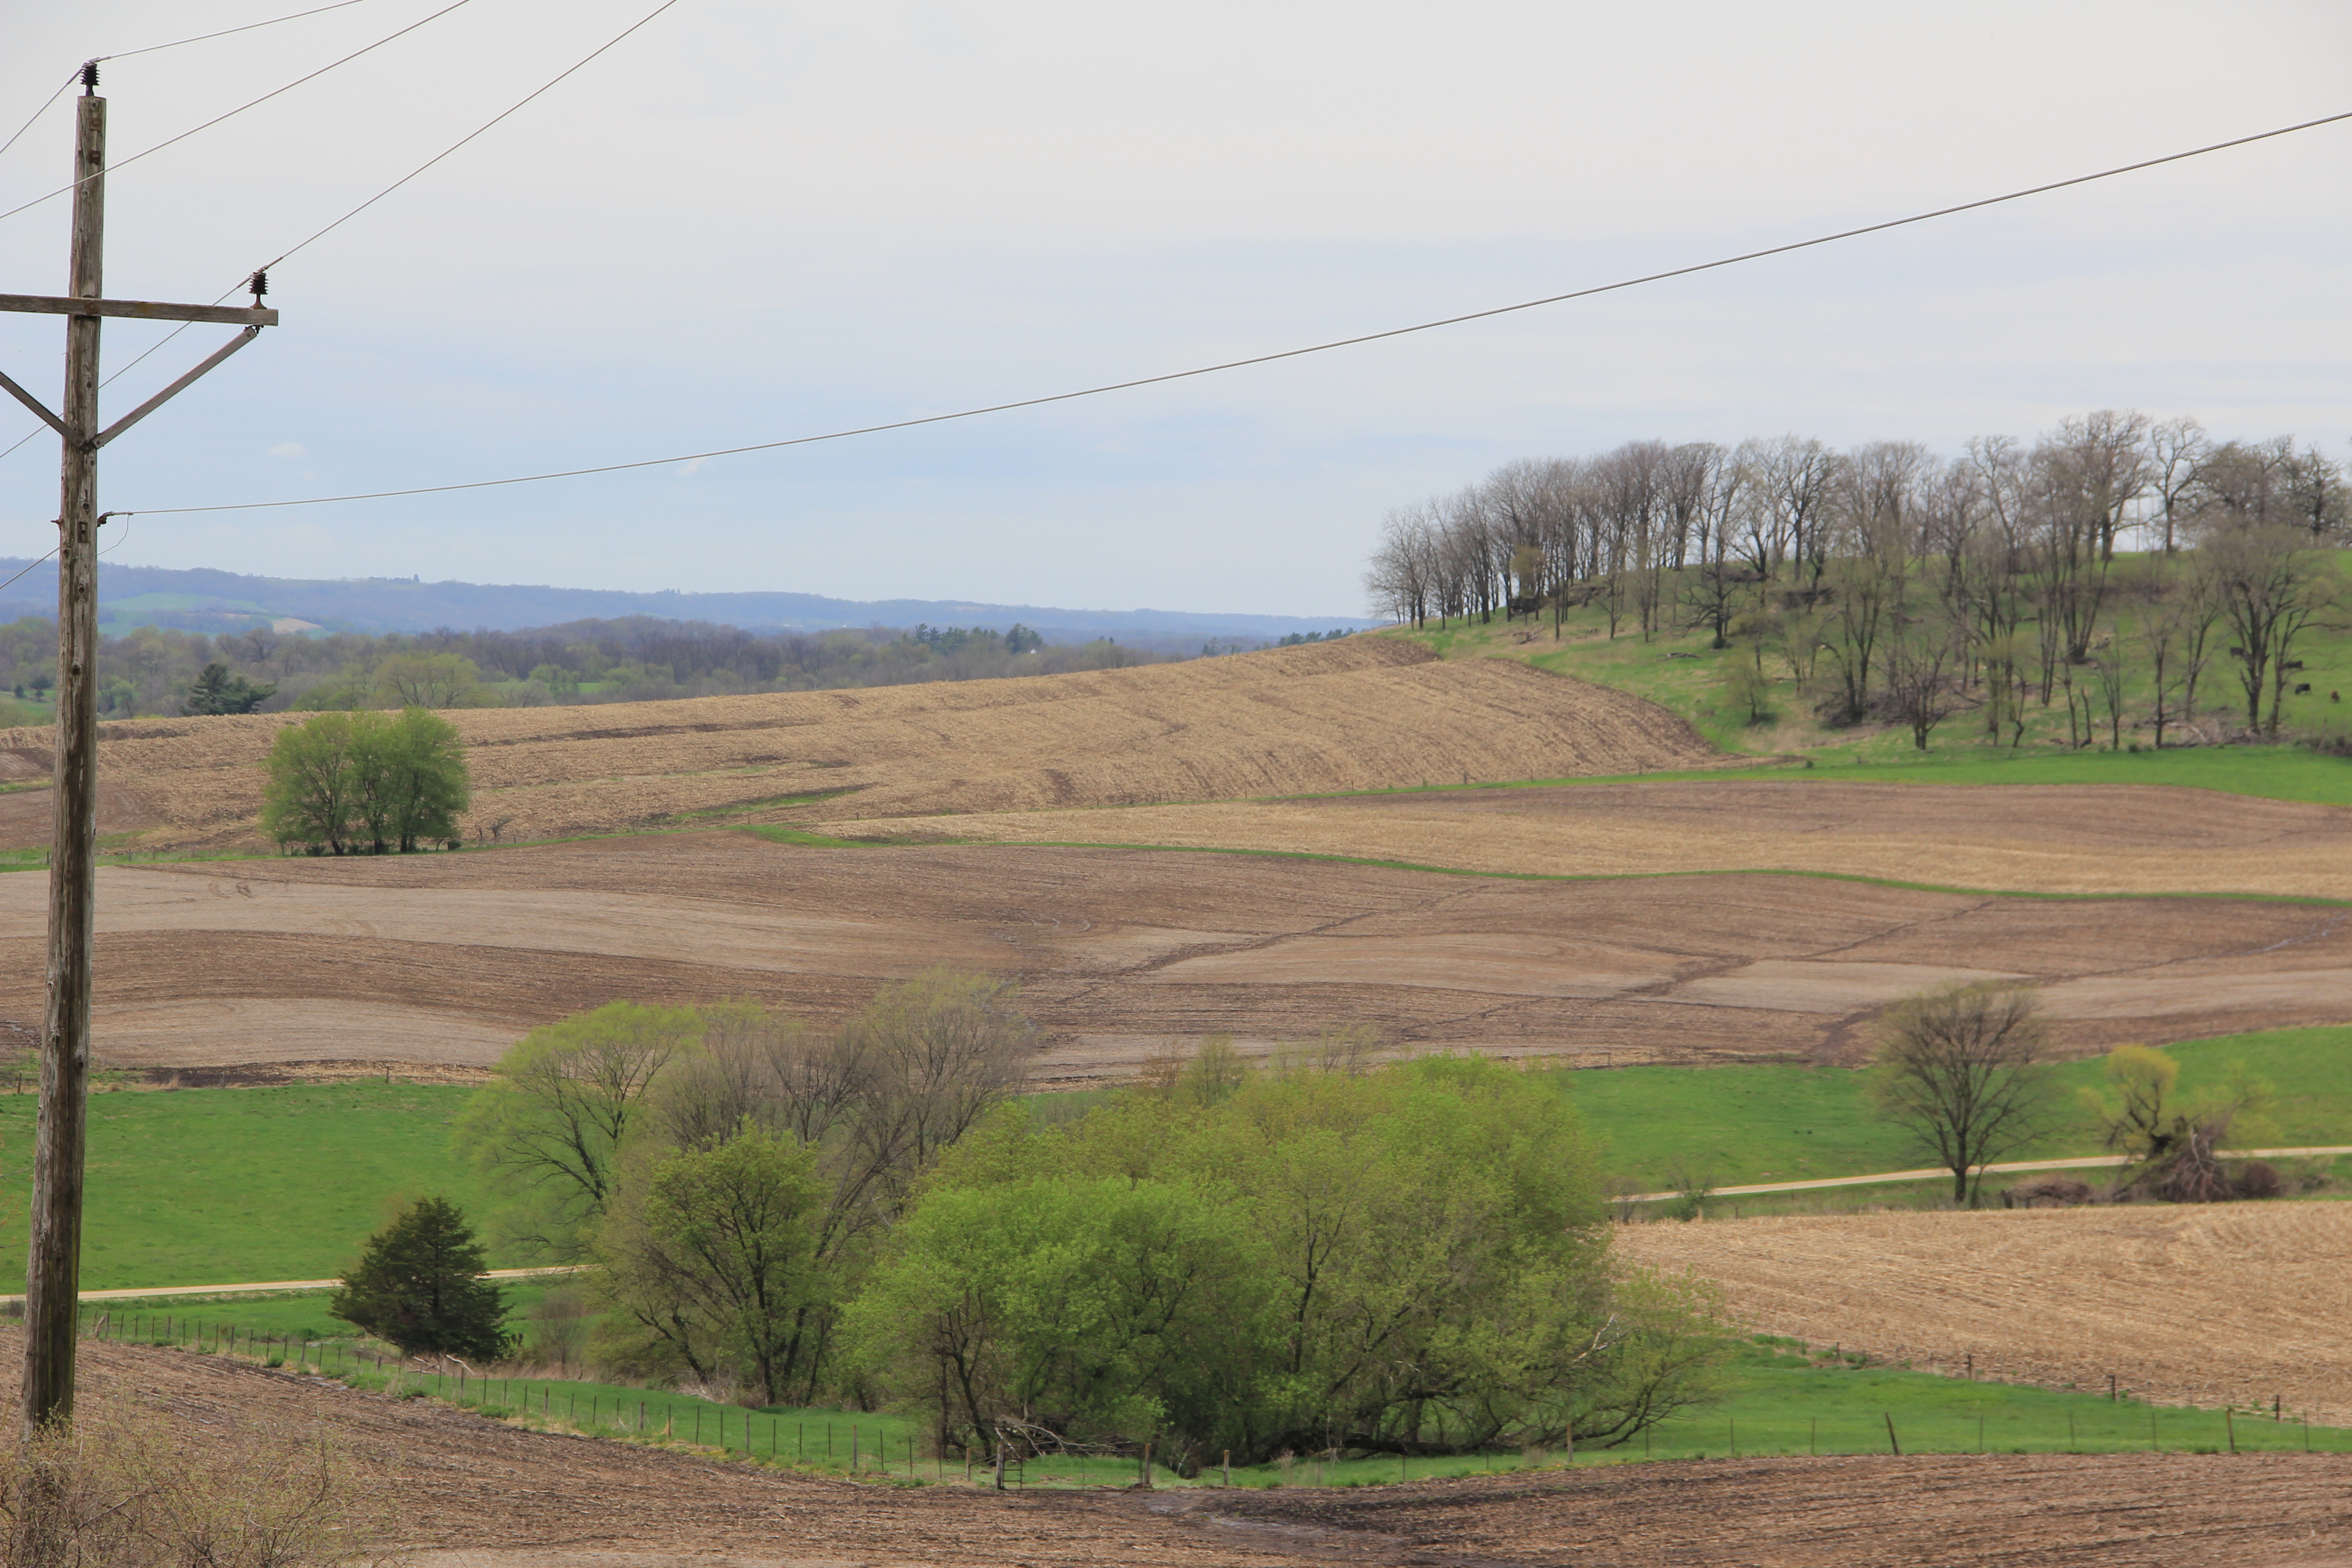
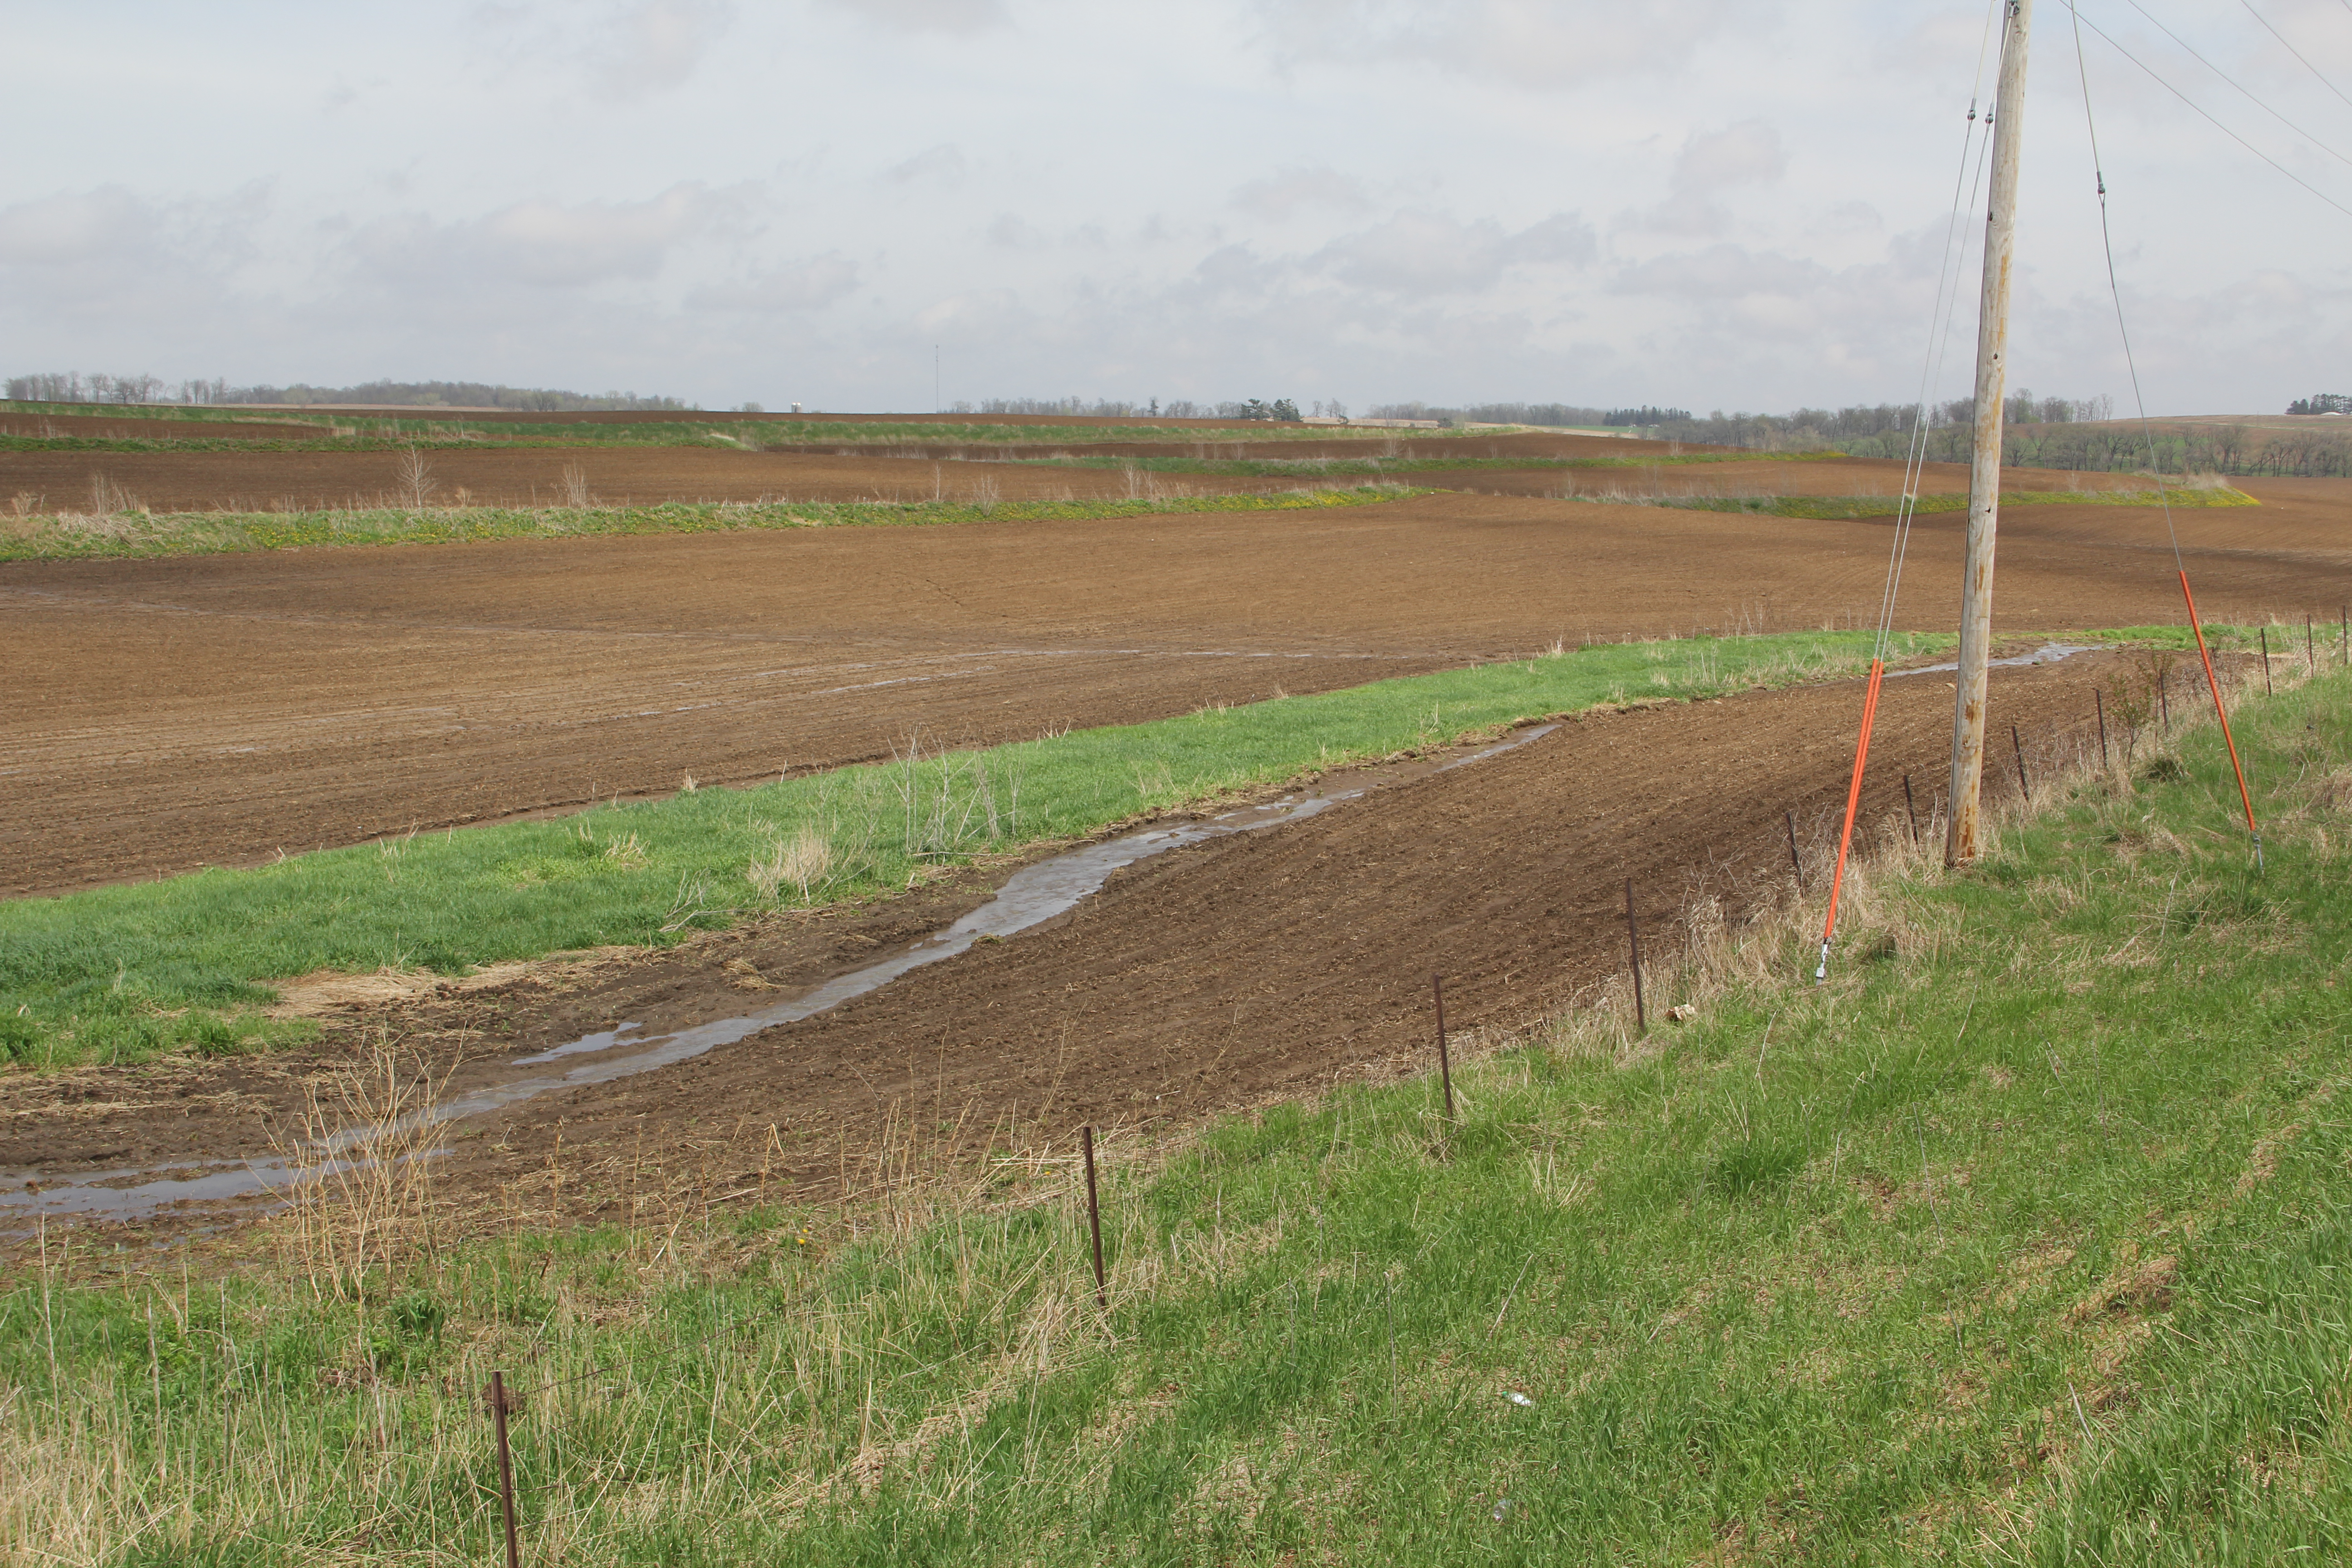
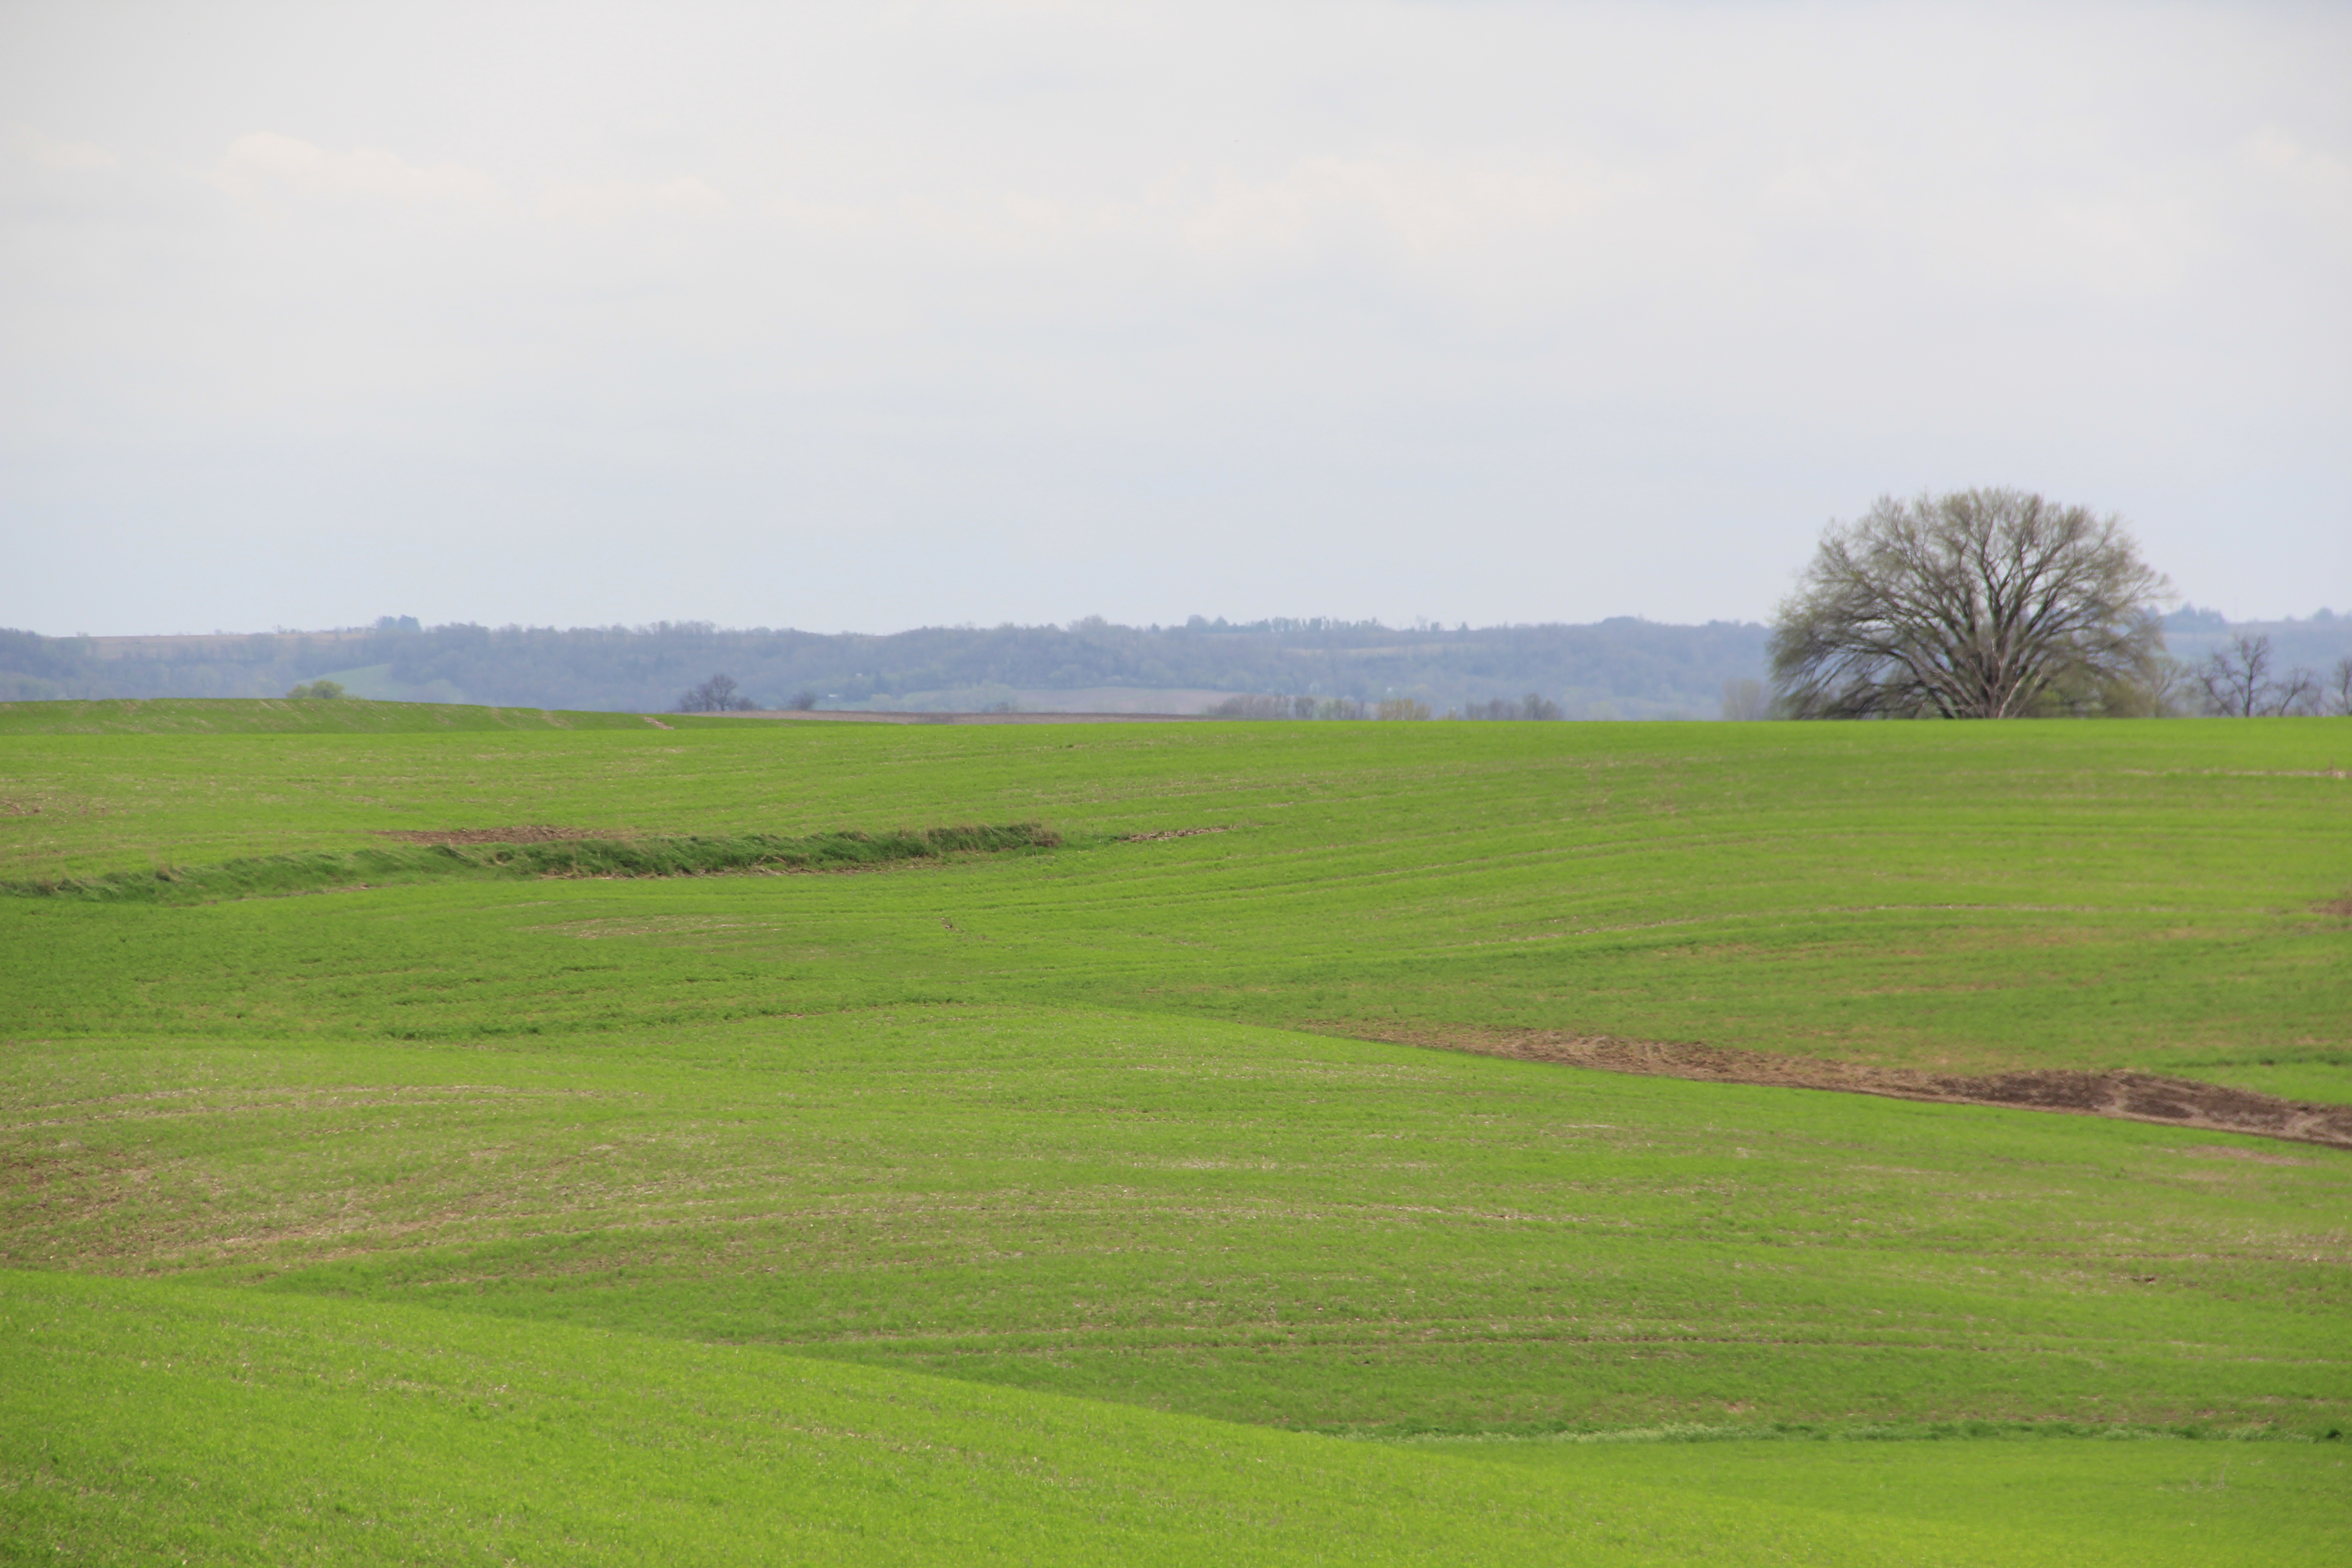
The cover crop on this field has been sprayed in preparation for planting. The crop was well developed and still provided adequate protection against erosion and runoff.No grass waterways are used in this field resulting in 10-15 rills like the one in this image. This is an indication of poor soil health and structure.This field has a grass waterway and is either no-till or had yet to be worked this year. No erosion was visible.Strip cropping is a common technique used in Northeast Iowa to prevent erosion. Perennial vegetation, such as alfalfa, is alternated down the slope with a row crop such as corn or soybeans. Rainfall and storm water runoff slow and are filtered as they flow through the perennial vegetation. However, no perennial crop was used between the strips of row crops in this field resulting in significant erosion and increased runoff. The small stream below these fields was quickly impacted by the sediment and increased volume of runoff.This field has been no-till for 25 years and has already been planted for the year. No erosion is visible.Excess tillage. Zero crop residue. No grass waterways. The light colored soil on the hilltops indicates that most of the rich topsoil has already been lost off of this field. A significant deposit of soil is in the road ditch.Although there is a grass waterway here, tillage along the edge of the waterway has given the water a path, rendering the waterway ineffective at stopping erosion or slowing runoff.This field has a nice growth of cover crops and has very little if any erosion. The cover crop has protected the valuable soil and retained most of the runoff from this field.
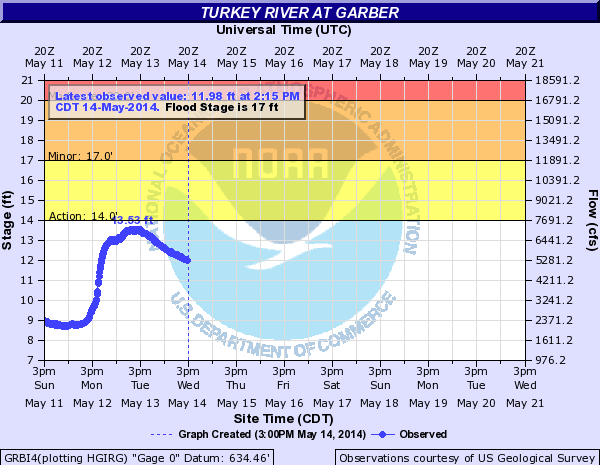
The hydrograph from May 14th shows how the Turkey River at Garber responded to the rain. The blue line represents the water level of the river. The river rose approximately five feet in a few hours following the rain. A 2.43 inch rainfall is fairly common and can occur several times per year. As you can see from the graph, any additional rainfall would have brought water levels into flood stage, represented by the colored portions of the graph.